Friction Circle: How To Tell If You're Using All Your Grip

Friction Circle Introduction: How to tell if you are using all your racecars grip.
If you are using all your racing cars grip then fast lap times will follow. But how can you be certain of how well you really drove? Could the “friction circle” help you?
Here is a comprehensive guide to the friction circle. Prefer video? You can now also watch a full lesson [link] on explaining the Friction Circle from my Master Your Tyres [link] course.
If you enjoy this article, be sure to subscribe to my weekly email, “Ahead of the Curve,” to make sure you never miss the latest.
Driving verses Setup: The Key Difference
In motorsports, knowing how much more performance you could have delivered is an extremely difficult challenge.
As a track driver, you should be using all your racecars grip, all of the time.
When you are setting up your car, you should be giving yourself more grip, more of the time.
Therefore:
Driving is about using all your cars performance potential.
Setup is giving the driver more performance potential.
Take nothing else from his article, take that ☝️
But how do you know if there is more lap time in the car or the driver?
The not-insignificant challenge is to objectively determine how well you have really done.
That challenge is what the “friction circle” can help with.
Therefore, the rest of this, rather long!, article aims to introduce you too.
By The End Of This Article You Should:
- Understand what the “friction circle” is.
- Knowing how you can use it to precisely and objectively access your driving performance (even with the simplest data logging equipment),
- Have the foundations to easily zero in on where (and how) you need to improve.
- Have a robust way of determining if you have been able to engineer more grip into the car.
- Know how professional motorsports teams, such as Formula 1 teams, go about solving this same problem.
OK. Below is the table of contents for what I’m going to cover (I’d grab a coffee!). This article is a bit text-heavy at the beginning but there are lots of pictures (even a video) later in the article so hang-in there.
”How well did I really do?”
I’ve a question for you:
How do you objectively assess your driving performance?
I am not talking about how you compare to others but how you compare to what your racing car was capable of.
You can only do your best with what you have - but are you?
This article will explain how you can use the friction circle to start to get answers to that deceptively simple but highly-infuriating question. Answers that will help you improve.
Plus, at the bottom I detail how Formula 1 teams go deep this with a first-time-ever-seen-on-the-internet picture.
Understanding what the friction circle is and how you apply it might completely reframe how you think about performance success in motorsports - it certainly did for me.
How Well Have You Really Done*?*
Yes, you can stick it on the pole, win the race and set fastest lap but, how well did you really do?
As in, how well did you actually perform at getting the most out of your racing car?
Maybe, with those results you do not care too much? ?
Perhaps though, you are not quite getting those results … not every time out …
Perhaps you find yourself in a really competitive race series and are wondering how others can possibly be driving faster than you?
You may feel you are already flat out so how is it possible to go any faster?
Is it your race driving or the racing car? How can you tell?
How Would The Pro’s Do With Your Race Car?
You might be wondering what performance your racing car could achieve if you plugged in a Pro driver (like many affluent people do.)
Just how much faster would the Pro race driver go in your car? A lot? A bit? Not at all? I was luck enough to have a Pro drive my car - so the answer is about 1 second per lap! - but how was he doing it. What could you learn?
Equally, what about if you had hired the services of a professional race engineer, or even a whole professional race team?
How much more performance would these pro racers be able to find in your racing car? And how would you know?
If you are reading this, the honest answer is likely to be either:
- You already know, or
- You are not really sure.
Assuming it is the latter (and you are at least curious) then this article is for you.
It aims to introduce you too:
- New ways of thinking about your racing performance, and
- The types of data that you can use to objectively assess your performance (and improve …)
Imagine if you had the foundations to start answering questions like:
- Where and how should I be braking for each corner?
- What is the best racing line (for my specific racing car)?
- How can we tell if we have engineered a car improvement?
- Where (and how) can I improve?
What I am going to introduce you too is not new (I certainly did not come up with the concepts) but not often discussed.
It took me a long time to discover you can do this. This was after years of aimlessly asking “paddock cup champions” for their advice and opinion.
If that has been you too, asking others for opinion on how to improve, then worry no longer.
Not Opinion, You Want Certainty
Whilst well-meaning, all these paddock champion chats can be at best vague and, at worst, delusional.
What you want is a robust way to measure your own performance so that you can improve.
This is what I’m going to do my best to introduce you too, here in this article.
It is a bit long, it is not that well written (I do maths!) and it might challenge your thinking - possibly everything you ever thought about racing performance?
But hang-in there.
The friction circle is honestly your golden nugget.
Take the time to consider what I am putting to you and when you have the lightbulb moment, feel free to let me know by signing-up to the newsletter and sharing this article with your friends (or keep it to yourself ;) … but sign-up all the same! )
OK?
Let’s get started …
Friction Circle Is About Defining Grip
This subject is all about “grip.” Sadly grip is not something you can directly measure.
In fact, the more you think it through, defining “grip” becomes increasingly difficult.
Think about this.
How would you explain “grip” to a 5 year old?
You cannot use analogies like friction because that is not how tyres actually work (see my article on how tyres work here.)
You know your racing car has a kind of “grip limit” so you could start off down that route. Then you could state that if you exceeded the limit then you “lose grip” and that normally ends in a bad outcome.
But that still does not explain what grip is.
What you do know is that whatever “grip capacity” you do have is massively variable each time your race car hits the track.
Weather, temperatures, weight, tyres and many (many) other factors all contribute to what “grip” you end up with - and these all change to some degree each and every lap.
Defining grip is really hard.
How Do You Even Drive At All?
I got really into this at one point.
I was developing some vehicle simulation models. This is where you “build” a car in the computer and drive it around (virtually) testing its performance.
What dawned on me, as I tried to make this simulation work, was how difficult driving a car actually is.
To this day, I am still amazed that anyone can drive a car at all - any car, let alone a racing car!!
I won’t go super-geeky-engineering into why, but just think about this question for a second:
How do you REALLY know when to brake for a corner?
Forget race tracks for a minute.
How do you know when to brake for any corner, in a car, even on a regular road?
I still have no clue how we do it so well to be quite honest.
Yet, in general, humans are staggeringly good at driving cars.
Appreciating this is highly relevant to your quest to understanding how to maximise ALL the grip your racing car has on offer.
Measuring Grip With G-Forces
The measured data I am going to suggest you start to look at is some of the same “data” that you sense as human when driving your car - namely acceleration or “g-forces”.
A racing car’s grip limit aligns with its peak acceleration(s)
That is huge.
Whilst you cannot measure grip directly, you can easily measure acceleration.
What Is “Acceleration” ?
As you brake, turn the steering wheel or apply the throttle, you are accelerating the racing car.
- What do you do with your feet is Longitudinal acceleration.
- What you do with your hands is Lateral acceleration.
- Up and down is Vertical acceleration … but hopefully not often ?
Focusing on the lateral and longitudinal accelerations - as this is a racing car, not a fighter jet -when you “run out” of grip, you also hit the peak of acceleration.
You might refer to “running out” of grip in situations where your racing car starts to slide or gets wheel spin or locks up under braking.
When these events happen you have reached maximum grip … and … because you have run out of grip, you cannot generate any more acceleration.
This means in your racing car - peak grip is equivalent to peak acceleration.
This Is Great News!
This is great news as it means that you can use acceleration data as an inferred metric for grip.
Acceleration is what you feel when you drive a racing car the limit .. and … luckily … humans are very sensitive to even small changes in acceleration.
These small changes in acceleration are what gives you the early warning signs that you are about lose grip.
The more acceleration your racing car can generate, the more grip it must have, and therefore the faster the car can go.
Great.
But, if you want to be truly maximising your racing cars grip there is just one more piece of the puzzle to put in place.
After this I will explain to you how this all works and (if you have not guessed already) explain where that cone picture fits in too.
So consider this:
What if you had a racing car with unlimited grip?
If you had that, what would your ultimate lap look like?
The Ultimate Lap
Consider these two fundamental assumptions:
- The shortest distance between two points is a straight-line.
- Every racing car has a maximum speed.
What you are trying to do is go around the race track as fast as possible.
The race track is a loop of a fixed distance.
Therefore the fastest way around any race track is surely to:
- Drive in the shortest distance corner apex to corner apex (i.e. a straight-line) and,
- Never slow down (i.e. drive at the cars maximum speed ALL round the lap.)
Brakes are for stopping in the pits, no?
Now, before you think I’ve gone mad think about this …
Why can’t you do that?
What stops you from doing taking this crazy TRON style approach to racing?
The answer of course is the previously discussed grip limit of your racing car.
In practice, your racing car simply will not go around every corner at maximum speed, especially taking that kind of racing line.
But what IF …
- you were not limited by your racing car’s grip limits.
- your racing car was like TRON and would not have to slow down for ANY corners.
IF that that was the case, what would be your ultimate lap time?
Well, your lap time would be solely determined by the distance you took to go around the track (your racing line.)
So if you drove a shorter lap (i.e. straight-lined from apex to apex) then you would get round in less time … and … you would be faster.
The ultimate lap is therefore the shortest distance driven at the your racing cars maximum speed.
This idea is actually key to minimising your lap times…
Enjoying this? If you want more of this kind of insight as well as instant access to ALL of our exclusive subscriber only resources, please signing-up below ;)
Minimising Your Lap Times
To minimise your lap times:
You need to drive the shortest distance around the lap that your racing cars acceleration limits will let you.
As a race driver this means:
You need to ALWAYS have your racing car at its maximum acceleration, whilst driving the shortest distance possible around the lap.
If you can do this then there is nothing more you (or anyone) could have done to drive your racing car faster.
As a race engineer your job becomes about increasing your racing cars maximum acceleration potential.
The higher the maximum acceleration that the car can generate, the more potential your racing driver has to go faster.
Take a moment to think about this.
All racing folklore, all racing “wisdom”, is essentially trying to explain this same thing - only now you can measure it.
If you can measure your performance you can improve it.
The Friction Circle
You may well have heard of the friction circle?
If not you may have seen the little “g-force meter” people include on their YouTube videos. Here is one from the VBOX:
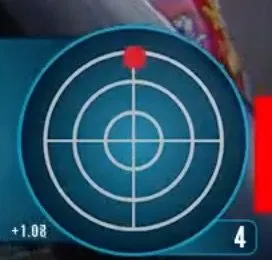
This is a plot of lateral and longitudinal acceleration that your race car generates through a lap.
In the image above the racing driver is braking at the car’s limit. You can tell this because the little red dot is at the top of the circle. If they were hard on the throttle the little red dot would be close to the bottom.
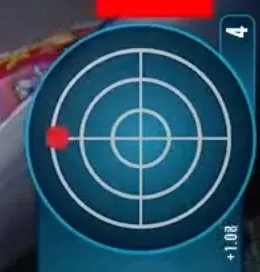
Also, if the driver was cornering at the racing cars maximum grip, then the red dot would be over on the far left or the far right, depending on the corner. Something like this:
Quite often I suspect people see this little red g-force dot bouncing around in these videos but do not really know what it is telling them?
Now you know that this red dot will show you the cars acceleration peaks. It can also indicate the racing cars grip limit in braking, on the throttle and during cornering.
But there is a bit more.
Combined Lateral and Longitudinal acceleration
The thing is you can have combinations of lateral AND longitudinal acceleration.
For example, you can brake AND you can turn at the same time.
Now (sadly) you cannot have say maximum braking and maximum turning at the same time.
What you can have is a bit of both. How much has lots of variables but essentially, you can go from say maximum braking to maximum cornering by taking the red dot around the edge of the friction circle.
I’ve tried to show this in the image below, with the red dots.
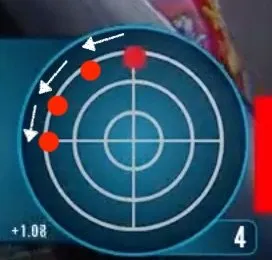
What this is trying to show you is that the driver can go from:
- maximum brakes to,
- slightly less brakes and some steering to,
- hardly any brakes and more steering to,
- no brakes and full steering.
This is more commonly called “trail braking.”
As the car does this the red dot (largely) describes a circle - so that is why people call it a friction circle.
Maximum grip is shown by the Friction Circle
The friction circle represents the maximum grip you have in your racing car.
To minimise your lap times, you need to be maximising your racing cars grip potential by driving the shortest distance around the track that your racing cars grip limit will let you.
Therefore you need to make sure that your racing car is always operating at the edges of the friction circle.
A Real Data Example
In practise it is a bit less clear cut than an actual circle.
This is because your racing car will have much more ability to stop than to go.
(I’m trying my best to avoid using the word “accelerate” when talking about getting faster in a forward direction! … it is hard! ;) … but anyway)
This means the “friction circle” normally looks more like a lying down capital “D” shape.
Here is some real data from a session at Donington in the UK:
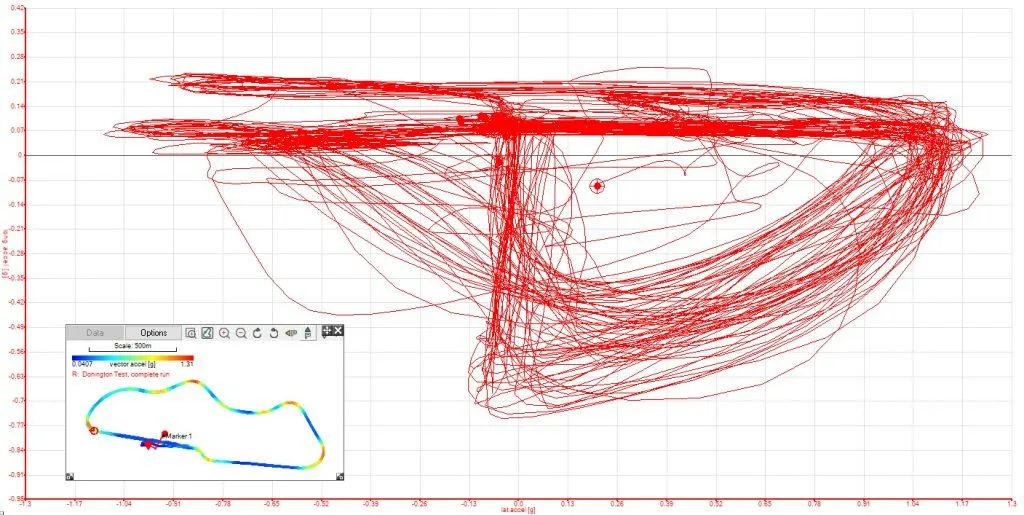
The lateral acceleration is on the x-axis.
The longitudinal acceleration is on the y-axis.
Hopefully you can clearly see the D shape outlined in blue below:
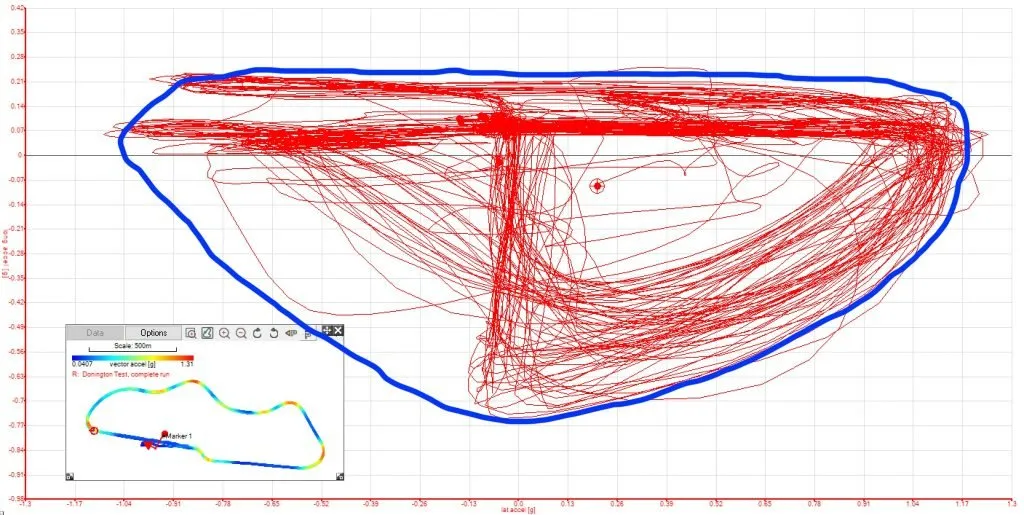
Sticking on this blue line is the key to maximising your racing cars grip - it is the maximum grip capacity of this racing car.
G-G plot is your objective measure of performance
You can now judge the session performance.
Apart from when you are travelling in a straight line, if you are not on or close to the blue line, it is likely you could have gone faster.
No ifs, no buts. No opinions needed.
There is actually quite a lot going on in this data. Therefore you will see below that I have put together a short 1 min video to show you three fast laps from the data. This is accompanied by a detailed explanation of what is going on.
Take your time on this next bit as this is where everything comes together - and (hopefully) it all becomes super clear for you…
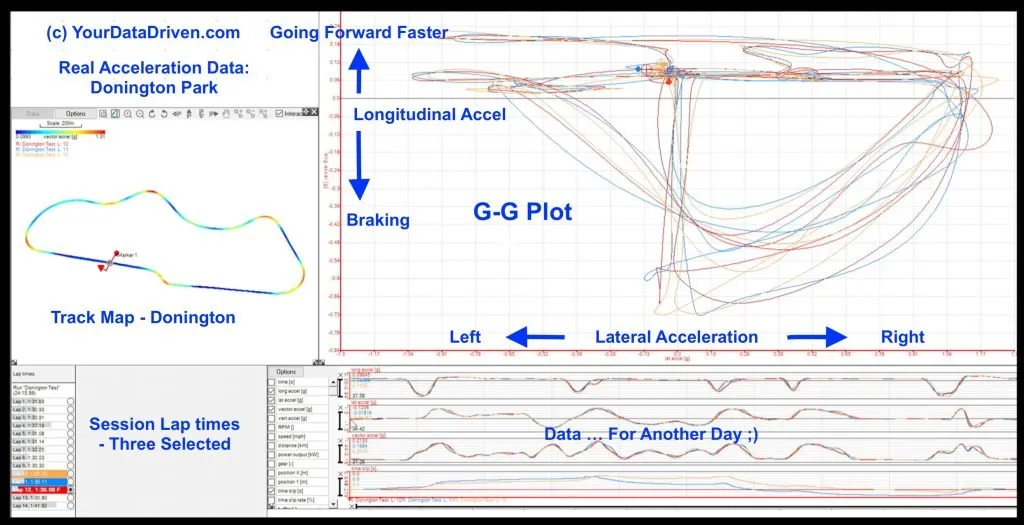
Video Of 3 Fast Laps Looking At G-G Plots
The video shows the three fastest laps from that Donington session.
When you play the video (linked below), just try to imagine how you feel in your racing car going round corners like these.
Use this image below to decode what you are looking at on the screen.
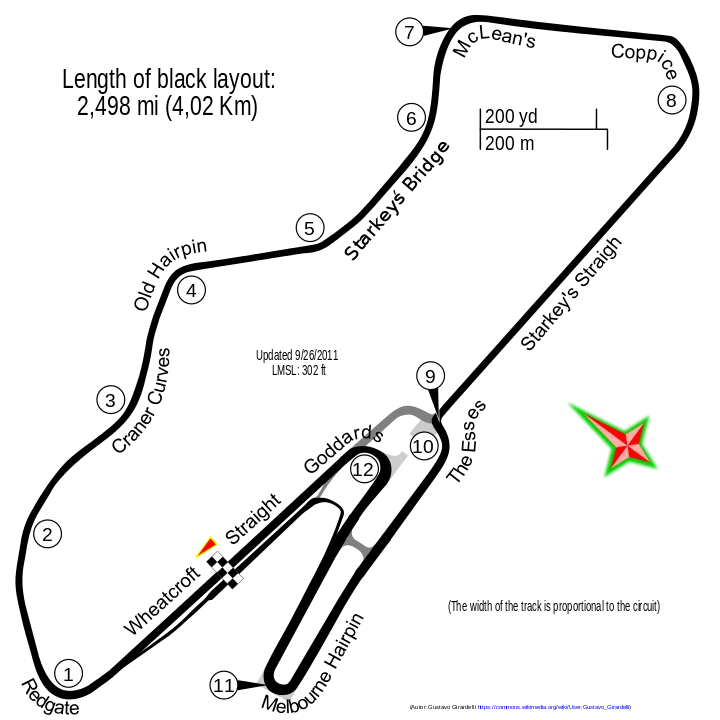
Use this image to decode the corner names at Donington Park.
In the video, first look for the little circles moving on the track map that show you where on the track you are.
Then look at the g-g plot to see if it matches how you think you would feel.
Do not worry about the stuff at the bottom right for today - this is where you get really into the details.
Watch it through fully once, then look below for a step-by-step description of what is going on.
See if you can follow along and see these same effects in the video.
Then think how you could use this to assess how well you are maximising your racing cars grip too.
The video is here (max screen it if you need too.)
Decoding the video: Starting to assess maximising your racing cars grip
0:00 Crossing start-finish line. Flat out in 4th Gear. Slowly moving over to left of track.
0:04 Hard on brakes in the straight line. Change down to 3rd. Heel & toe to smooth change. Good.
0:05-0:07 Trail brake to apex. Good.
0:08 Hard on the throttle, still turning, still in 3rd gear. Red lap: slight kick of oversteer, or wheel spin, on exit.
0:10 Change gear from 3rd to 4th. Still turning slightly. Could be smoother.
0:19 Unnecessary lift of throttle through Craner curves - chicken ;)
0:20-0:25 Old Hairpin. There is a lot going on here. In simple terms, could have braked later but the line on entry is probably the real issue.
0:29 Looks like a lift but isn’t. Going up hill here, so cannot accelerate as fast.
0:35-0:39 Similar issue to Old Hairpin. Blue is best. There is more time here with better entry line.
0:41-0:42 Could possibly brake a little later but good trail brake.
0:42 Nicely early on the power. Not all racing cars will allow that but this is a low powered car.
0:51-0:55 Worst corner. Hard on the brakes but way too early (chicken again ;) ). Trail brake in but already over-slowed car. Good exit but speed on straight compromised.
Analysis focus on the Chicane Entry
I won’t go into this too much but maybe you can see the acceleration under braking for the chicane is kind of “bobbing about” after the initial brake application and before the turn in?
That is not great. It is not helped because of the down change in gear but regardless, compared to braking for the first corner the racing car is well below the maximum possible for this corner.
If you want to be maximising your racing cars grip, this is not the way to do it.
What is good is that racing driver is doing this consistently on each of those three laps. That means he probably is using a fixed braking reference marker each lap. If so then he just needs to find another one, a bit further (like about 50+ metres!) down the track - and get a bit braver!
I suspect the race driver is losing over a second of overall lap time because of this one corner. The chicane also happens to be a major overtaking point for this track so this driver really should get their act together here…
Top 3 improvements for the Race Driver:
- Braking later for chicane - try count “1” at current braking point, then braking
- Entry line for Old Hairpin - try to get the car more settled during the braking phase
- Entry line for McLeans - try braking in a straighter line
Top 3 improvements for the Race Engineer:
It is not all about the driver remember! Straight-line braking seems to have some strange lateral acceleration so check:
- The front to rear, alignment of the data logger (and any software correction)
- Corner weights - consider using more diagonal cross-weight to help the driver with 2) and 3)
- Front brake system for matching left to right braking force
Objective Performance Assessment With G-G Plot
You can now see how much objective information you can get, just from acceleration data. the friction circle totally blew me away the first time I discovered this.
That racing driver was actually doing pretty well ( it is me yay ;) ) except in a few areas - and now you know precisely which areas.
Even without watching the video, knowing what you now know you can see that the race driver is not maximising all the grip.
The acceleration lines are not always near the maximum grip limit (i.e. the blue line from the earlier image above).
Therefore there is lots more of the racing car’s potential not being use.
The racing driver could have gone faster.
The Foundations Are Laid. Well Done!
You now know where to start in terms of trying to analyse your racing performance. The friction circle reveals so much in just these g-g plots.
With some practise you can start to easily see how well you could have done.
The g-g plots give you great pointers as to where you could start to improve.
What is better though is that they are completely objective and that means you get total certainty about how much grip you have extracted (or not!)
In summary, get the racing car operating more on the edge of the friction circle for more of the lap and you will be faster.
No question. No “paddock cup champions” needed in helping you in maximising your racing cars grip.
BONUS - The Race Car Performance Envelope
In professional motorsports, they refer to these friction circle acceleration limits as the racing cars performance envelope.
The image at the top, copied again below, shows the performance envelope of a modern Formula 1 car.
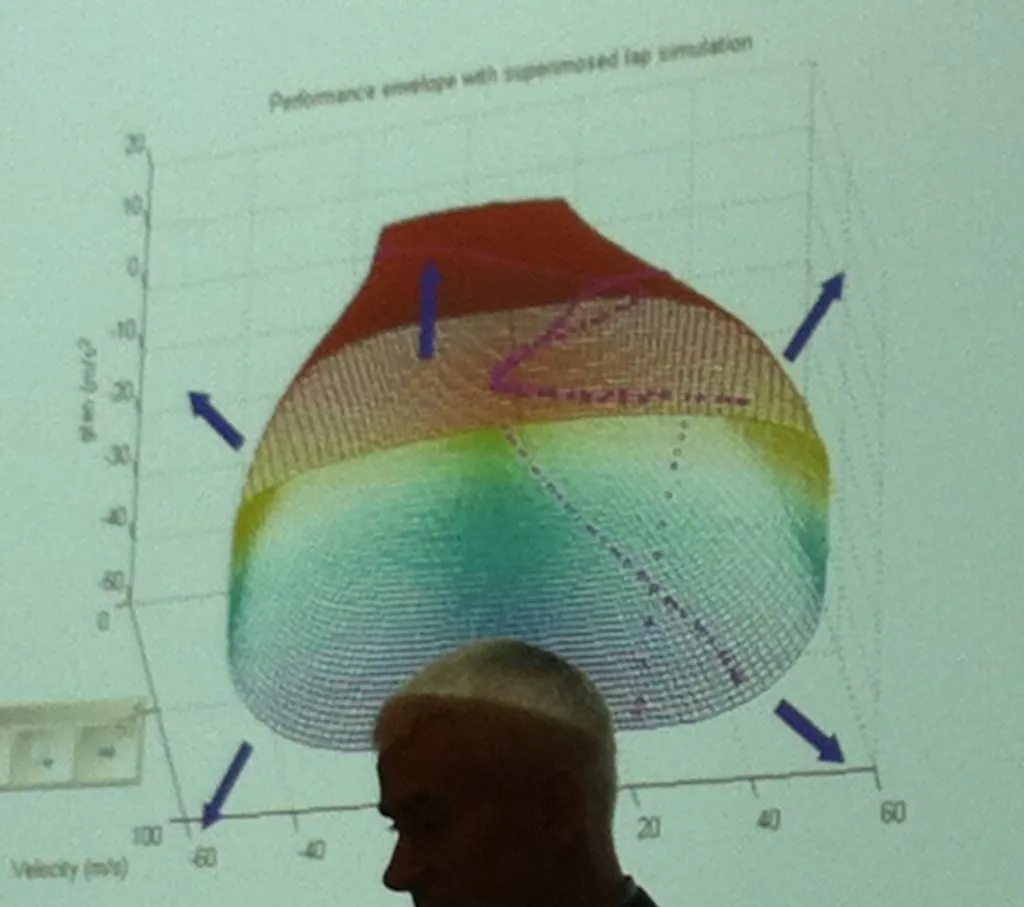
It is exactly the same stuff as I have just been discussing here.
Friction Circle Turns Into A 3D Cone
The reason it is a 3D cone however is that a Formula 1 car has aerodynamics.
This means that a Formula 1 car gets more grip as it goes faster. The aerodynamics press the car into the road, helping the tyres generate more grip.
This cone is the same friction circle we have discussed, but elongated to show how in a Formula 1 car you get more grip (or a bigger friction circle) at higher speeds.
So the axes in that image are the same lateral and longitudinal acceleration axes as we have been looking at. The third axis is the racing car’s speed.
It is called the G-G-V diagram - the V being for velocity.
The blue arrows
What about the arrows?
The arrows are saying exactly the same as what I have been discussing here i.e you, as a race engineer, want to make the acceleration limits as big as possible.
Making your acceleration limits bigger will enable you to minimise your lap time because you either do not have to slow down as much and/or you can take a racing line with a shorter distance.
Cool, hey?
There is one more thing about that picture.
One last thing that starts to show you what kind of advantage a Formula 1 team has over you and me.
The purple dotted line
Can you see the purple dotted line?
That is a vehicle simulation superimposed on the performance envelope.
That purple dotted line is, therefore, the equivalent of what the ultimate driver could in that racing car, at that track - I can’t remember which one but it is not likely to be Monza … 8-)
It returns a simulated lap-time but, as you now realise, it is much more valuable than that.
What it does is enable the race engineering team to directly compare the theoretical driver with the actual driver. They could then use this to easily highlight where the driver has the opportunity to improve.
In fact, this is quite a simplistic model. For example, it doesn’t include track gradient, or different track surfaces or wind directions or many (many) other real-life things. But hopefully, you can see how this still could be useful?
Performance on a Formula 1 racing car resolves down to making this G-G-V plot bigger.
And that is exactly the same goal for you with your race car too.
Concluding With Donuts - Friction Circles Remembered
Made it this far? Great work!
To finish, it might help you to remember this like I do.
You can call the friction circle “the donut” ;)

Therefore, this whole article can be boiled down to these two simple descriptions:
Your job as a racing driver is to always drive on the edge of the donut.
Your job as a race engineer is to make a bigger donut.
Simple.
I hope reading this has helped you to understand how it is possible to objectively measure your racing performance - either as a driver or as an engineer.
If you feel this adds value then please share online with people you feel could benefit from this insight - perhaps you can use it to solve an argument about how to drive faster around a track?
Clearly this is just the start in terms of maximising your racing cars grip but hopefully just knowing that working out how to go faster is NOT a matter of opinion should be valuable to you (and your fellow racers.)
Maybe sign-up (for free) below and let me know? Remember, newsletter subscribers also get instant access to an ever-expanding Vault of Goodies - free spreadsheets, tools, videos and exclusive content.
If you are not ready to join us yet then all good, feel free to have a look around at some of my other articles accessed here: https://www.yourdatadriven.com
Best of luck!
Enjoyed Reading About The Friction Circle?
Check out my Complete Beginners Guide To Motorsports Data Analysis Course here: /learn-motorsports-data-analysis/
If the temperature of your racing car tyres are out, you’ll be left wresting a bear. Avoid that and gain control of your car’s grip levels in this detailed guide: /what-should-the-temperature-of-your-racing-car-tyres-be/
Want to take the guesswork out of setting your tyre pressures? Try this article including a free calculator: /how-to-set-your-racing-car-tyre-pressures-perfectly-every-time/
Whenever you're ready, here are 2 ways I can help you:
Motorsport Skool — The paddock in your pocket. Nearly every course I've ever done, plus unlimited FREE Tech Q&A from our friendly community.
Master Your Tyres course — Go beyond guesswork and become totally self-reliant to tune and drive your tyres. Get more grip, better handling and faster lap times in any conditions.