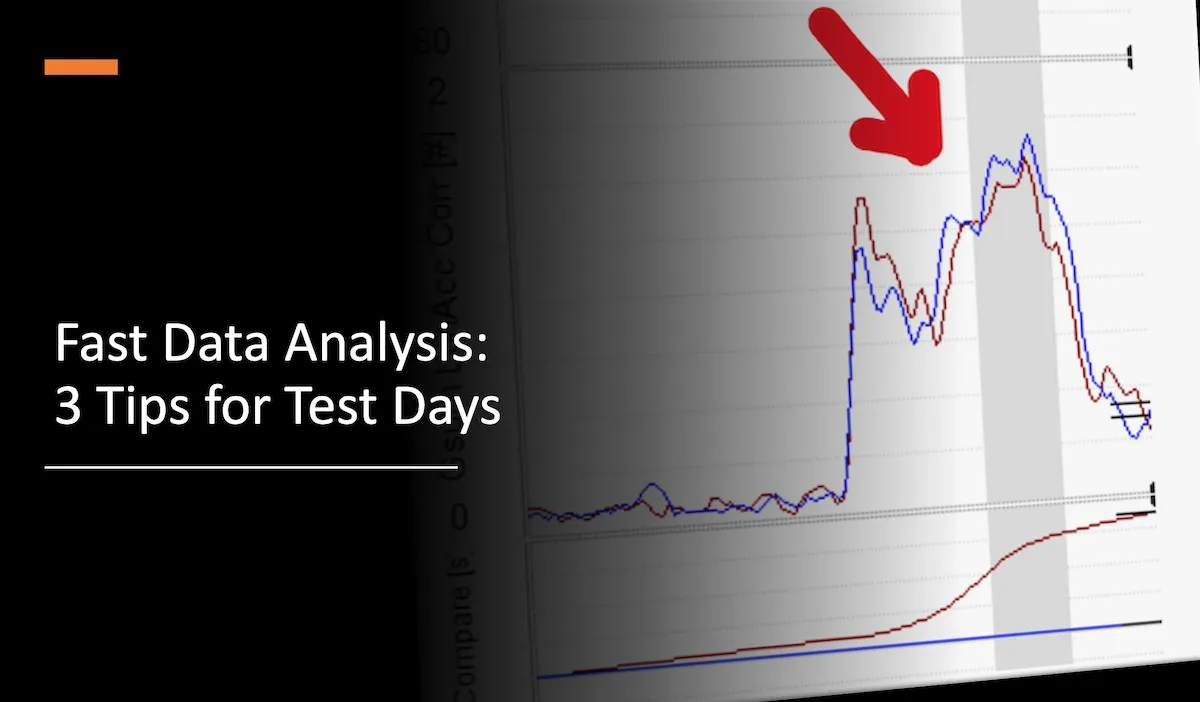
Fast Data Analysis: 3 Tips for Test Days
Mastering Fast Data Analysis on Test Days
Picture this – you’re at the track, the engine’s revving, and the adrenaline’s pumping. But instead of gripping the wheel, you’re navigating through a maze of data on your laptop. While others share their test day stories, you’re tangled in a web of graphs and speed traces.
Sounds familiar? Don’t worry. Many racing enthusiasts and track day drivers face the same challenge. We’re all here for the thrill of the drive, the camaraderie, and certainly not to be lost in hours of data analysis. And let’s not forget the car prep waiting for us before the next session. With time as the ultimate luxury, fast data analysis becomes our saviour.
If you enjoy this article, be sure to subscribe to my weekly email, “Ahead of the Curve,” to make sure you never miss the latest. You can even ask questions that get turned into articles, like this one!
Reader Question:
“I’m using a SmartyCam with my AiM. I usually download all data into Race Studio 3 and analyse it at home. What can I quickly review right after a session?”
Ahead of the Curve reader.
Powering Performance with Fast Data Analysis
You’re in luck. Let’s dive into three quick data analysis tips that you can implement right after a session, speeding up your improvement on the track.
1. Are You Using All the Track?
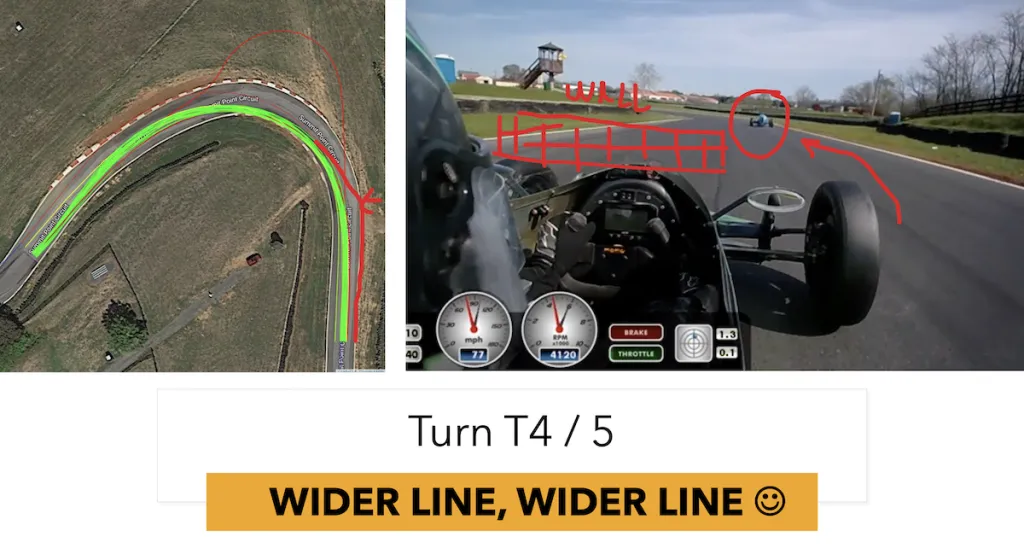
Use your SmartyCam footage to spot areas where you can use more of the track in a flash. Check for wide enough entries and exits, and proximity to the apex. Just a quick scan of your video can reveal all this.
For example, in a coaching session I conducted, you can see how I showed the driver how much closer they could get to the right side of the track, near the other car.
2. Which Corner Is Your Achilles Heel?
We all have that one corner that feels like a tough puzzle. Quickly identify the corner that’s causing you the most difficulty. To do this, pull up your best 3 or 5 laps. The ‘squint test’ is a handy tool for this. Check the speed trace for places where the lines diverge – that’s where you’re inconsistent. Reflect on what you’re doing on that corner, how the car is behaving, and what you’d like it to do instead. This simple analysis can quickly help you improve your next session.
Scroll to down about 3/4 of this page to watch a free video lesson explaining this process.
3. Can You Improve Your Corner Entry?
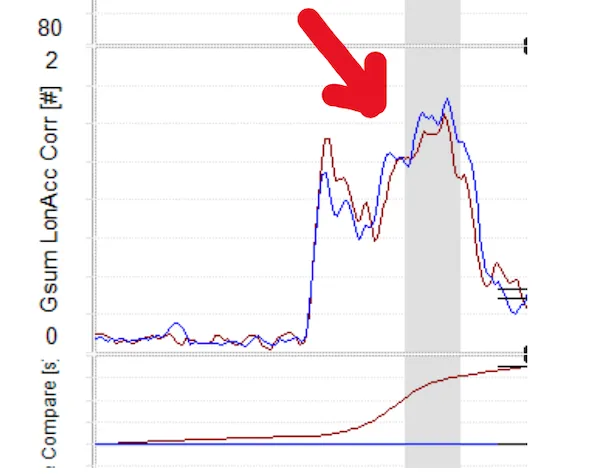
Corner entries are often a goldmine for improvements. To optimise yours, check out the gSum channel in your data. It should ideally show one smooth ‘hill’ per turn. If there are ‘valleys’, it indicates that you could either brake later, turn harder, or carry more speed through. This essentially means you’re not fully utilising the car’s grip.
Here’s an example from another coaching session where we started with this issue and managed to remove the dip by slightly adjusting the braking zone.
Reaping the Rewards of Fast Data Analysis
These three fast checks will not only save you precious time but also give you immediate, actionable insights for your next session.
The true beauty of fast data analysis is that you get to spend more time doing what you love most - driving. So, embrace the thrill of speed, both on and off the track.
Remember, a few moments spent in fast data analysis can transform your test day performance. It’s time to drive smarter, not harder.
Be sure to sign up below and let me know if you give this methods a try!
Good luck and have fun with it!
Found This Helpful?
Sign up for “Ahead of the Curve” below to never miss my latest articles on setup, data, and driving faster.
Car Setup Process – Going Beyond The Basics